

 |
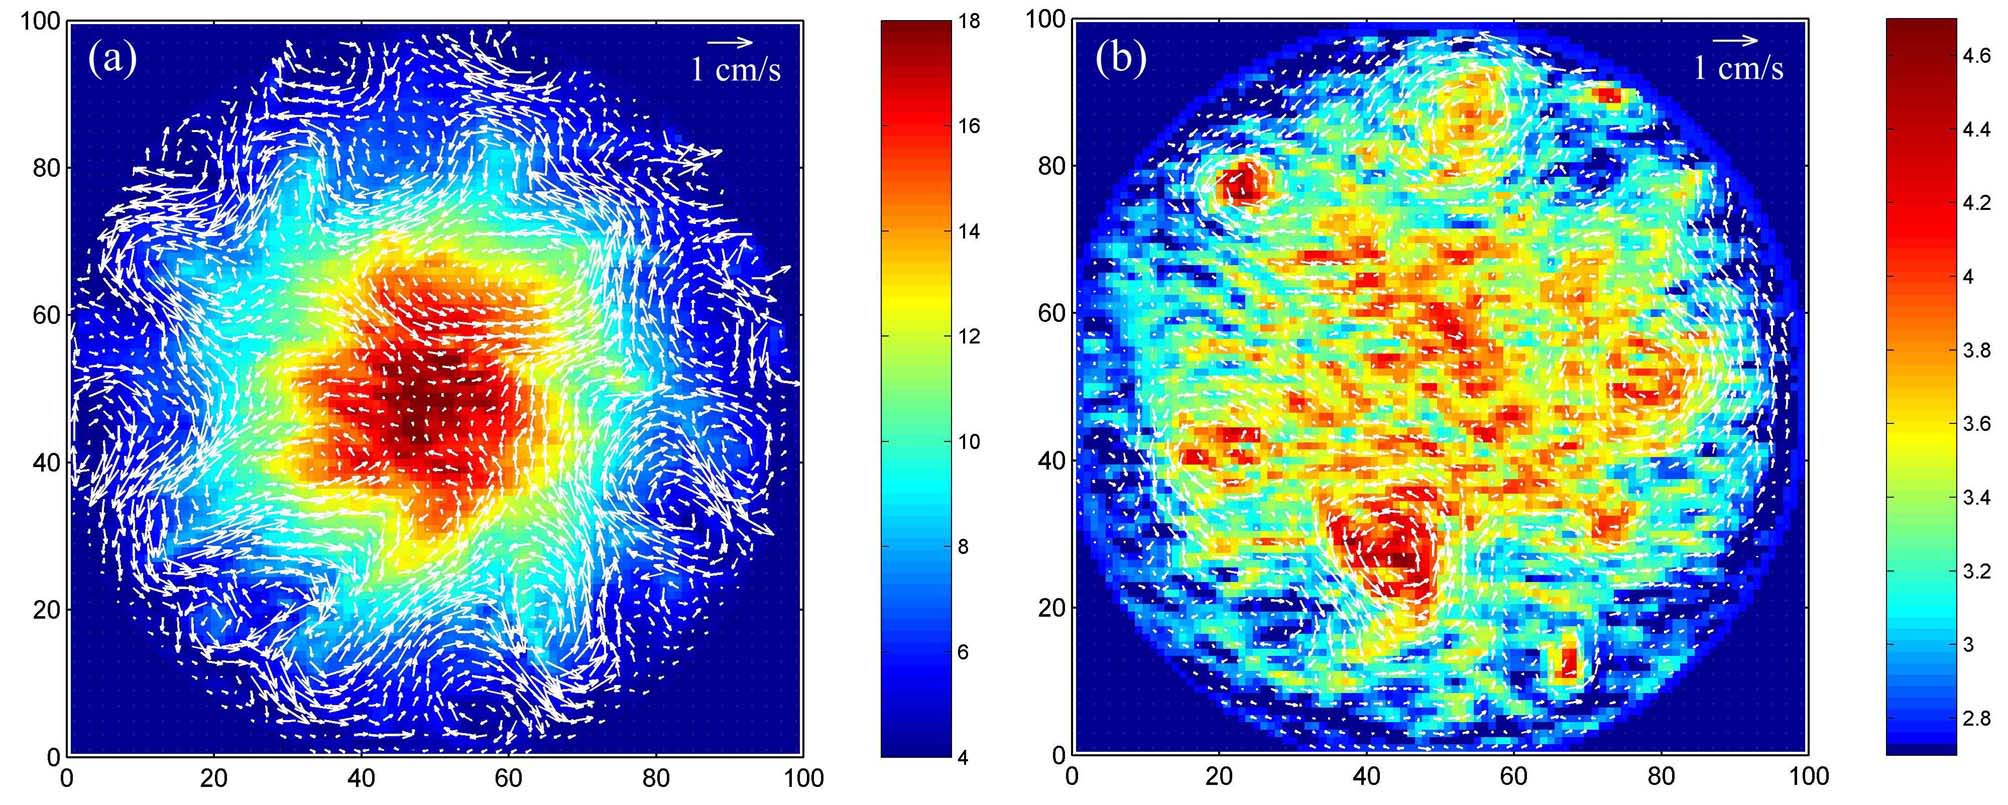
Vorticity (color) and velocity
(arrows) fields measured in two experiments with high and low beta. The color bar shows the potential vorticity scale in (s)-1. The arrow in the top left hand corner of each frame represents the velocity scale, 1 cm/s.For more detail see Afanasyev, Wells 2005
|
|
[Home page ] [Publications ] [Fluid dynamics gallery ]
|