Data
Cruise Reports and Presentations
Reports
CruiseReportTeam1.pdf
CruiseReportTeam2.pdf
CruiseReportTeam3.pdf
CruiseReportTeam4.pdf
CruiseReportTeam5.pdf
CruiseReportTeam6.pdf
Presentations
CruiseReportTeam1.ppt
CruiseReportTeam2.ppt
CruiseReportTeam3.ppt
CruiseReportTeam4.ppt
CruiseReportTeam5.ppt
CruiseReportTeam6.ppt
Log book
The log book:
FieldLog.pdf.
Ship track
The ship track file:
P6314_CruiseTrack.csv.
Info for CTD data
CTD data files are organized as follow:
- Column 1: Scan number.
- Column 2: Depth (m)
- Column 3: Temperature (deg C)
- Column 4: Salinity (PSU, i.e. Practical Salinity Units)
- Column 5: Density (kg/m^3)
- Column 6: Oxygen saturation (ml/l)
- Column 7: Fluorescence, chlorophyl-a concentration (micro-g/l)
- Column 8: Backscatterance (NTU, i.e. Nephelometric Turbidity Units)
- Column 9: Irradiance (micro E / m^2 / s)
Info for thermistors
Thermistor #6466 was just below the surface and all others
were 4 meters below sequentially.
Glider data from 2006
Glider data:
fieldoceangliderdata.mat
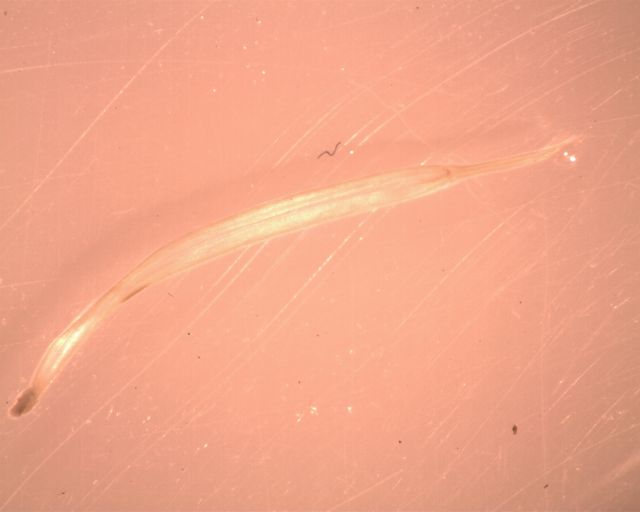
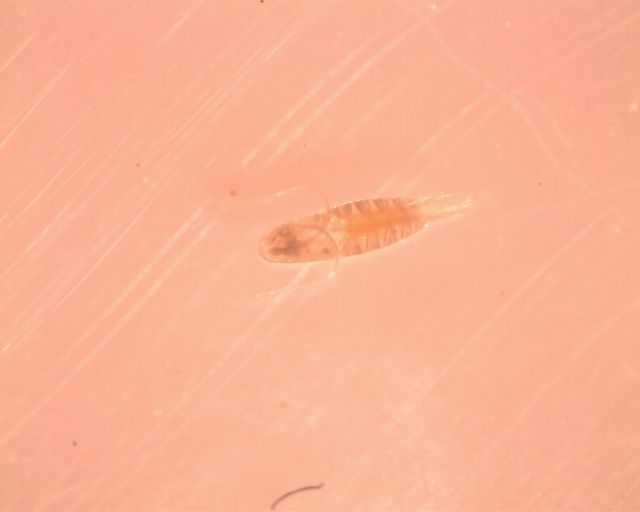
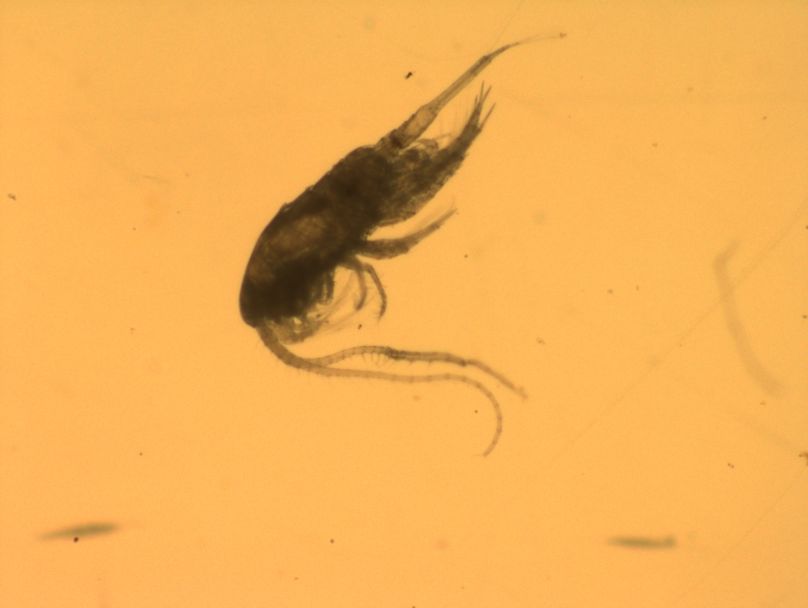
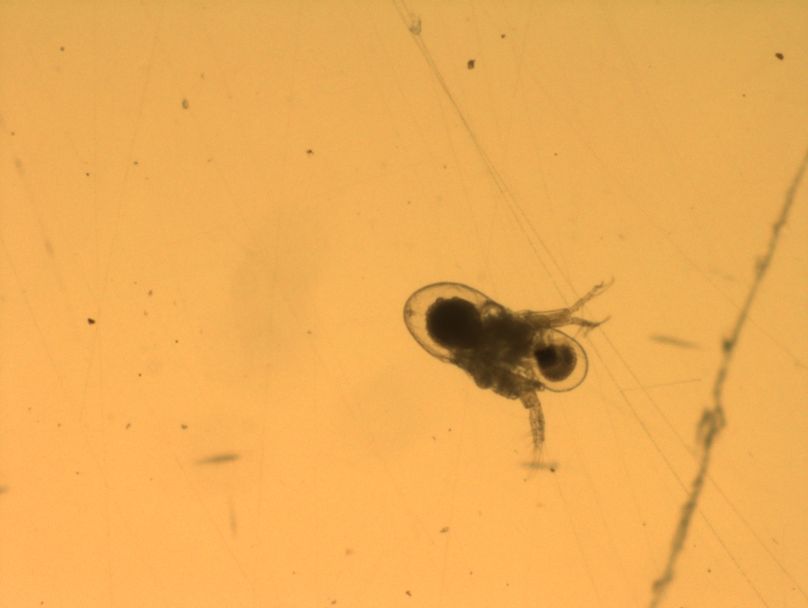
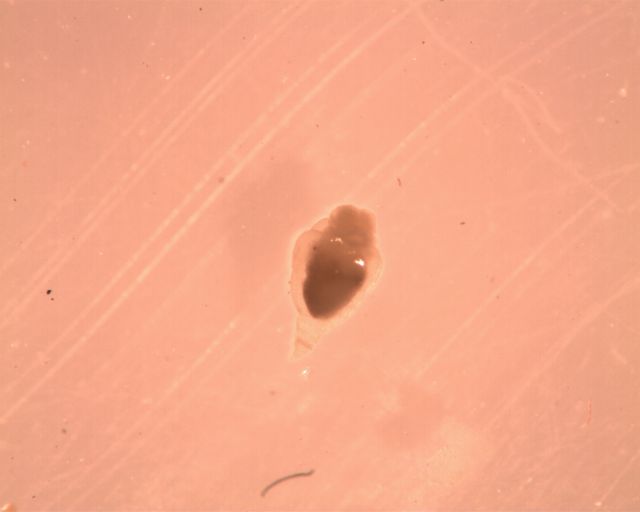
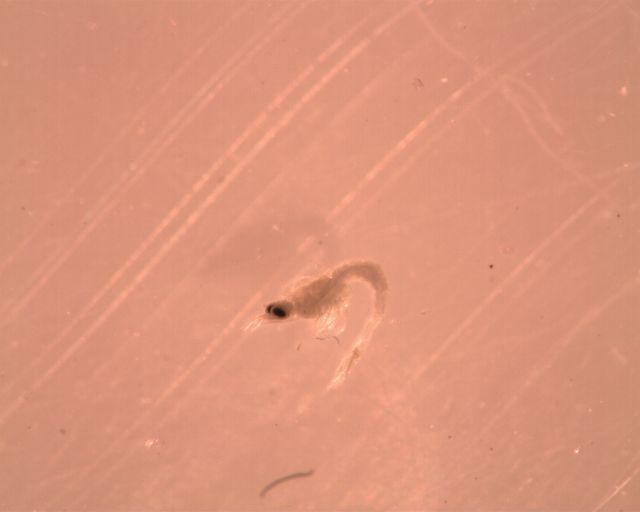
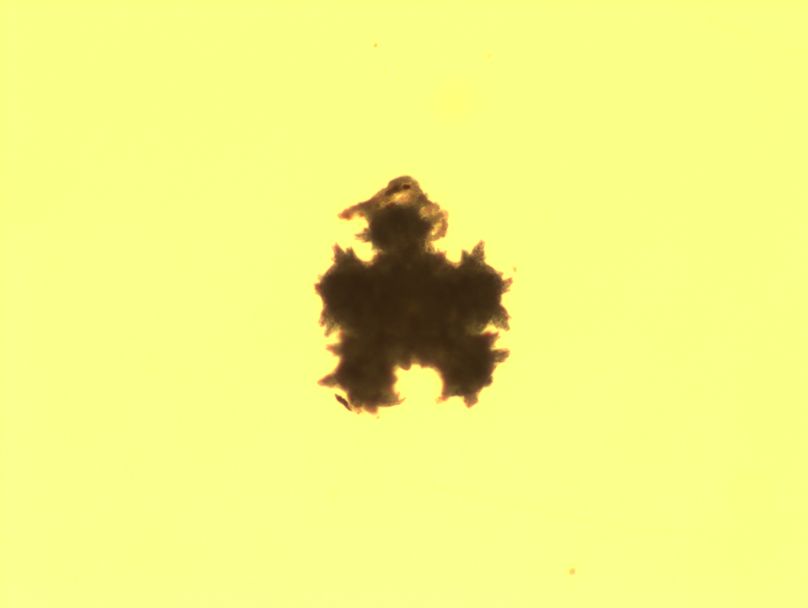
Biological data
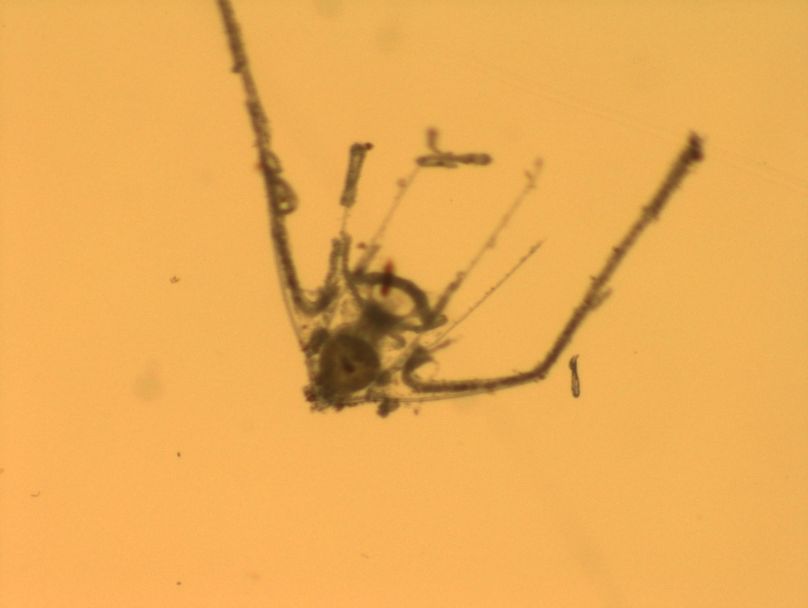
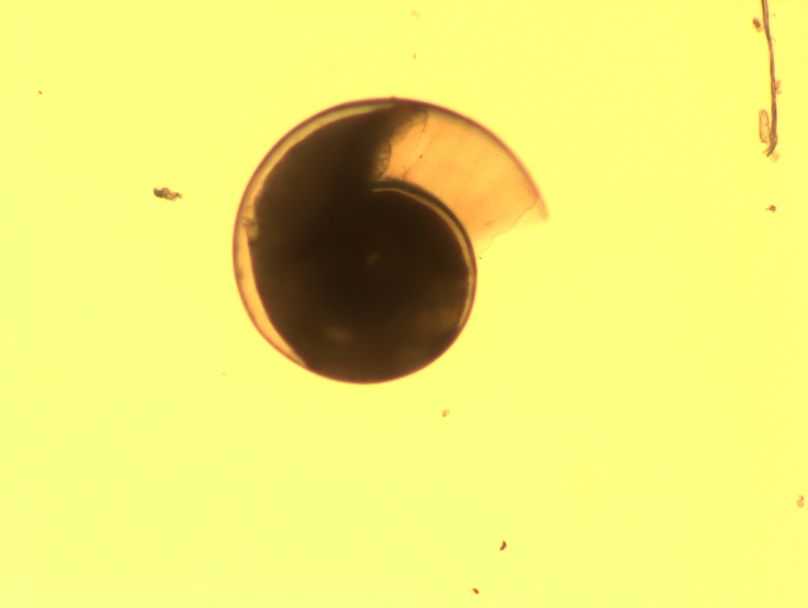
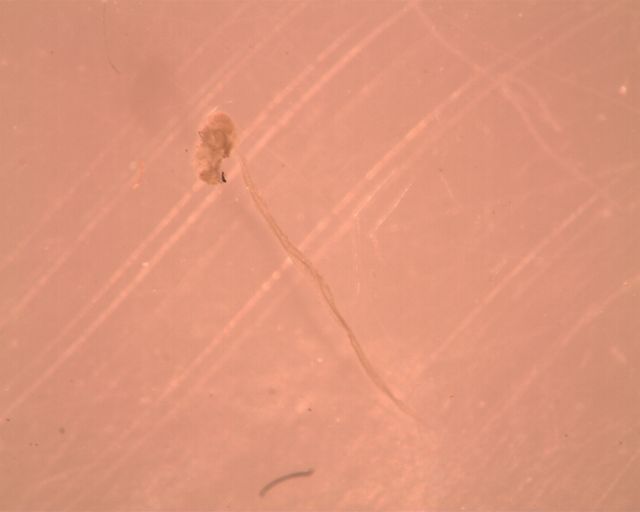
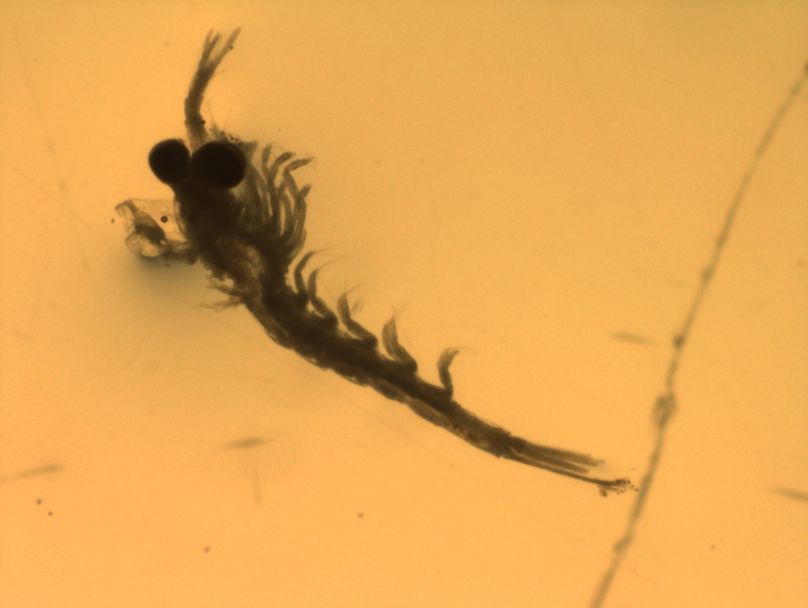
The data from the plankton sampling:
Biology_Data.xls
and the photos:
CTD data
A problem was found in the original CTD data with the oxygen.
The files contained the potential dissolved oxygen instead of the measured oxygen.
All CTD files have been remade with measured disolved oxygen. They are below:
CTD_ascii.txt.
Cast19.txt.
CDT Station 4.txt
CDT Station 6.txt
OCT ST1.txt
OCT ST2.txt
S1 8oct08.txt
S3 8oct08.txt
S1 Tickle.txt
S2 Tickle.txt
S3 New Tickle.txt
S4.txt
S5.txt
S6.txt
Station 01.txt
Station 02.txt
Station 03.txt
Station 04.txt
Station 05.txt
Station 06.txt
Station 07.txt